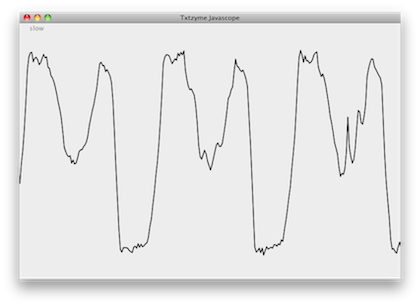
In my last post I described plotting Txtzyme output with a perl one-liner. I wondered, can I do better with a real graphics library? I was looking for something portable, like GD, but chose the already installed Graphics2D in Java 5 for convenience.

As a once Tektronix engineer I have strong opinions about what a waveform should look like. I'm pleased with the look I get with Graphics2D. I would have never thought that the joint and end-cap choices would matter, but they do, and anti-aliasing is a must also.
Once Scope.java is running and listening to a Teensy, one has only to send data-generating Txtzyme nano-programs down the other way to light the screen with waveforms.
Here is an included script called Timebase.sh that does exactly this, alternating between real-time and equivalent-time acquisition of my favorite source, 60Hz hum.
- while true
- do echo _slow_6d1o500{5sp16m600u}0o >/dev/cu.usbmodem
- sleep 10
- for i in 1 2 3 4 5 6 7 8 9 10
- do echo _fast_1o500{5sp}0o >/dev/cu.usbmodem
- sleep .348
- done
- done
Scope.java is organized as three separate threads. One reads Txtzyme data, another displays it, and a third handles user-input. Refreshing at 30Hz, Scope.java takes 15% to 25% of my MacBook Pro cpu resources.
The Javascope demo project joins several others in the Txtzyme repo on GitHub.
Evolved from other projects, Scope.java is a mixture of about three different coding styles each from a different era. I would love for someone to help me with a code review so I can bring this up-to-date.