While neatening up my shop I got to thinking how nice it is to just measure something on a whim. Next thing you know I'm logging the temperature of my soldering iron. It's Currie controlled. But how fast and regular are it's cycles? I didn't know.
/files/images/soldering-temp.preview.jpg]
Fifteen minutes later I'm looking at the waveforms in a spreadsheet chart that just happened to have three lines, one for each of the DS18B20s that I happened to have in the setup. Each response was noticeably different even with them that close together. I also saw large variations that might be due to air movements. Hmm. Let's improve the apparatus.
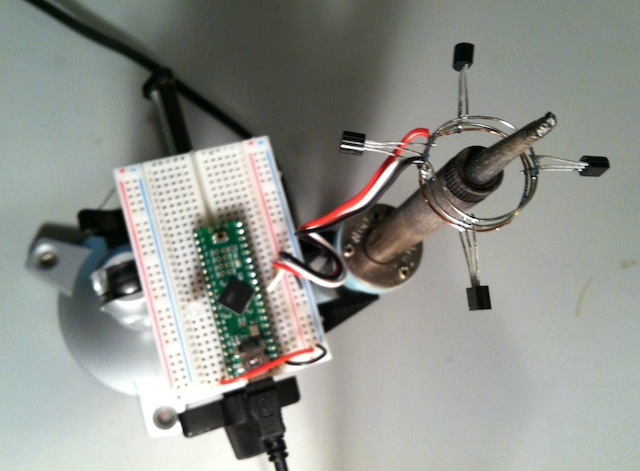
Now this thing responds. I can blow gently on it and see a response within seconds. Gently fanning it with a file folder from a foot away works too. So then I leave the room to see what the air does while I'm gone.
This takes the power R to resolve. I download this open-source package and read a few tutorials to remember the basics. First grab the data, focusing on most recent.
- r <- read('results.txt', sep='\t')
- z <- tail(r, n=1024)
Label the columns and make them look like variables.
- labels(z) <- c('w', 's', 'e', 'n')
- attach(z)
Find the average of all the sensors and then compare the deviation from this for each thermometer pair.
- b <- (w+s+e+n)/4
- plot(z-b)
Plot can draw all kinds of charts but this is the default when you give it a collection of columns (click to enlarge).
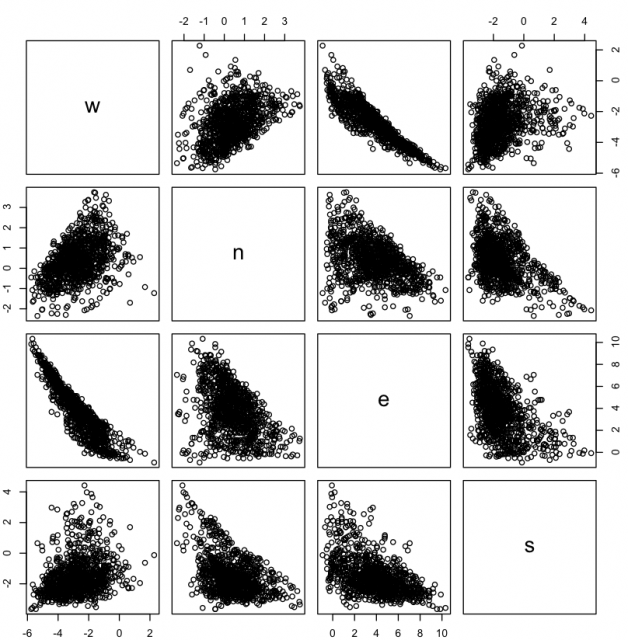
This shows the slightest of air movement variability in the e-w direction. Notice that only the east thermometer is swinging 10 degrees. There are also some outlier samples created as I returned to shut down the acquisition. Interesting.
This also gave me a chance to reacquaint myself with R. My spreadsheet was choking on data that R read and processed in a blink. FFTs and convolution filters were just as easy. Power worth mastering.