One often averages many measurements in order to cancel out errors. A lot of the noise in my shop comes from 60Hz power-line hum so to make measurements I average over 1/60th of a second, one complete cycle of the interfering noise. With my recent SensorServer conversion I started applying this technique everywhere which lead to a surprising result on one particular channel:
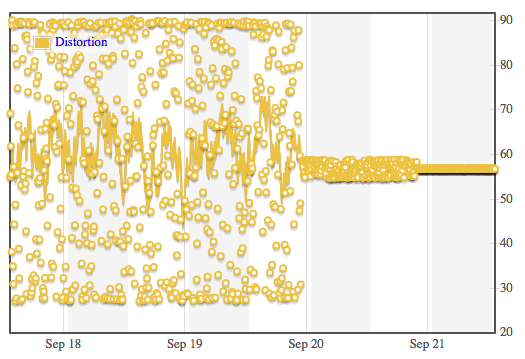
This shows my power-line waveform monitoring channel: All noise by this definition. Notice that it drops to near zero (peak-to-peek) on Sept 20. That's when my sensor network conversion happened (time here is reported in GMT.) I noticed the change a day later, wondered why it didn't drop all the way to zero, and started investigating.
I had been taking samples, 100 at a time, with the Txtzyme code "100{4sp150u}". This says, sample and print channel 4, wait 150usec, repeat. The timing is approximate here, because the other instructions take microseconds too. I ball-parked these numbers when dealing with my first hum problem. Maybe I can do better.
I wrote a command line script to sweep through various repeat counts, thereby varying slightly the period over which I observed the hum. I figured one of these values would be close to the desired 1/60 second. I'd know I had found the ideal number when the peak-to-peak value was the smallest. Here's what I found:
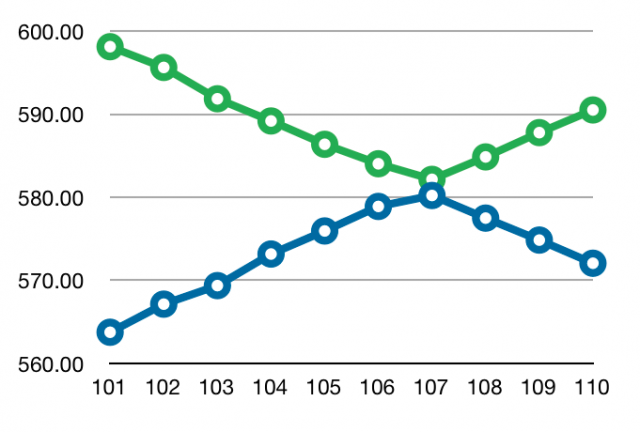
This shows that collecting 107 samples more correctly averages over the desired interval. It also tells me how fast Txtzyme runs by measuring it against the ac power as a timebase. If 107 iterations equals 1/60 second, then one iteration equals 155.8 microseconds. That means my loop overhead is 5.8 microseconds. Not bad.
I changed the loop count in my acquisition logic the next day and this shows in the first graph as a peak-to-peak amplitude of darn near zero. Cool, eh?
Comments
Engineering Best Practices
Yes, yes, I know I could avoid hum by building my circuits in properly shielded boxes. But I find that, er, confining. My approach to sensors has been to extract information from dirty signals rather than striving for clean ones.
Source impedance
Usually a low source impedance matters much more than shielding. Often it's just a matter of using lower value resistors or an opamp, though all sorts of tricky noise issues come into play once you start adding amplifiers. It's also possible to add a small value capacitor directly at the pin to ground... assuming the signal isn't from an opamp that would become unstable when driving a capacitive load. A tiny capacitor lowers the source impedance at high frequency, which is what matter when the A/D "samples" your signal onto its internal capacitor.
Interesting discovery. I
Interesting discovery. I think I showed off my analog temp sensor on a Teensy at the last meeting, and lamented that the readings were really noisy (+/- 3-4LSB most of the time, but occasional +/- 20-30LSB popping up every few seconds). I'll have to try different sampling frequencies and averaging methods; maybe I'm getting some 60Hz noise in there somehow.
Sub-LSB Accuracy
My graph suggests that the "ideal" repeat count would be between 106 and 107. I repeated my experiment, this time sweeping between 1060 and 1070 (integrating 10 cycles, not just one) and found 1066 gave me the best result: +/- one-quarter LSB.
Strange Shift in Mean Value
I modified my SensorServer logging of this particular channel to average over 20 cycles. This further reduces the 60Hz signal because I can more accurately specify whole cycles when I use larger counts.
What I don't understand is why the mean value would shift as it clearly has in this picture:
My sampling is not synchronized in any way that I understand so I can't explain why it would favor noise in the positive direction over the negative.
Measuring Waveform Distortion
I'm only now getting around to my original purpose for this sensor: observing the waveform distortion (flat-topping) caused by the spread of switching power supplies. Here is the signal Txtzyme Remote sees for my AC line:
Notice that the peak of this signal is not particularly graceful as we would expect from the sine function. I quantify this distortion using the crest factor, the amount that a peak voltage measurement differs from a True RMS measurement. I compute it as follows:
For a pure sinusoid, the crest factor is 1.414. The last step here converts the computed value to a percentage of the ideal where anything less than unity would indicate flat-topping.
I'm now logging this and will alert you all should our grid's wave shape deteriorate unexpectedly. Right now, at my house, it is running around 97% of ideal.